
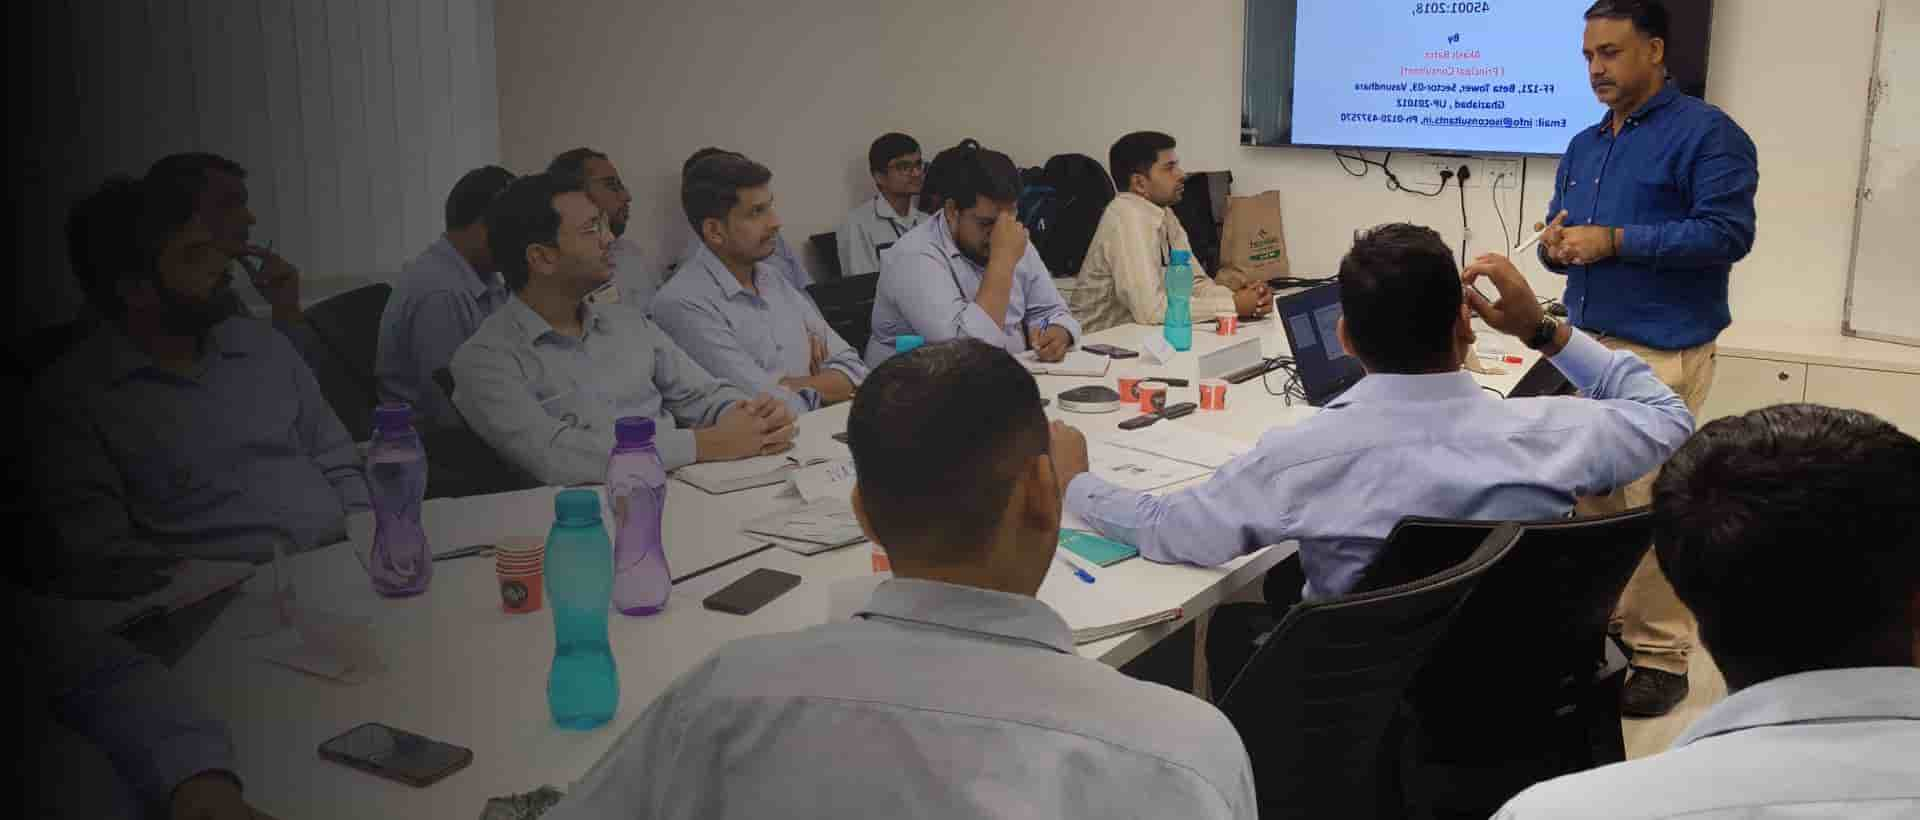
Consulting
Design management systems and improve the processes your teams use every day.
Explore consultingDesign management systems and improve the processes your teams use every day.
Explore consulting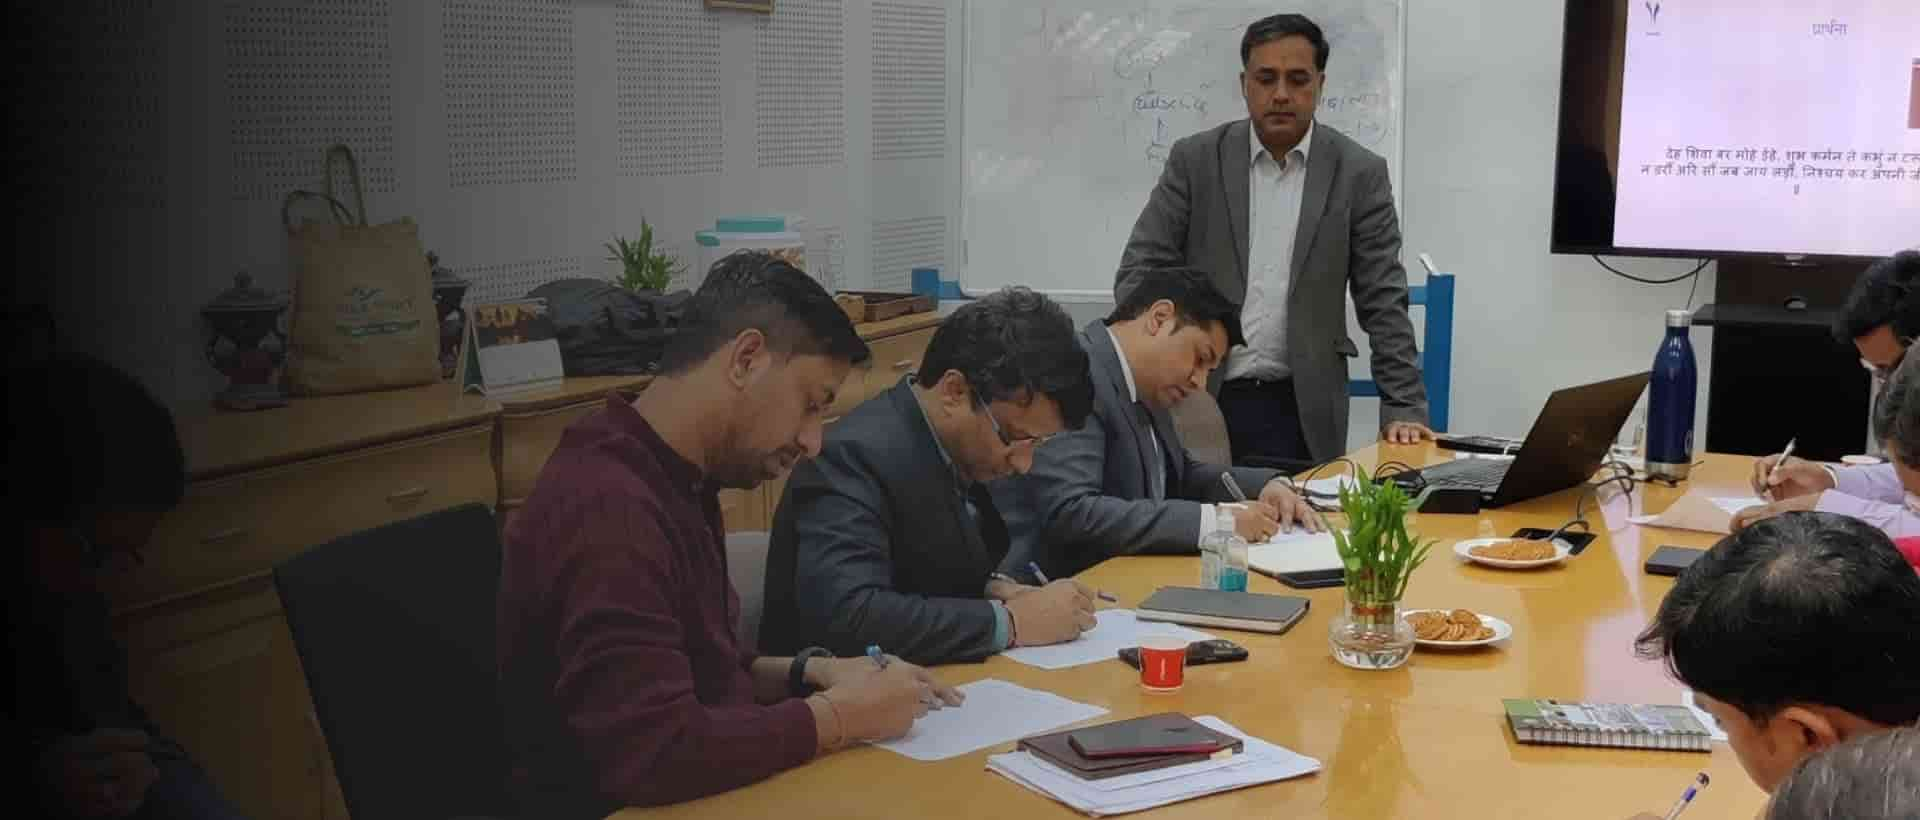
Assess supplier, production and management system controls using evidence from actual work.
Explore auditing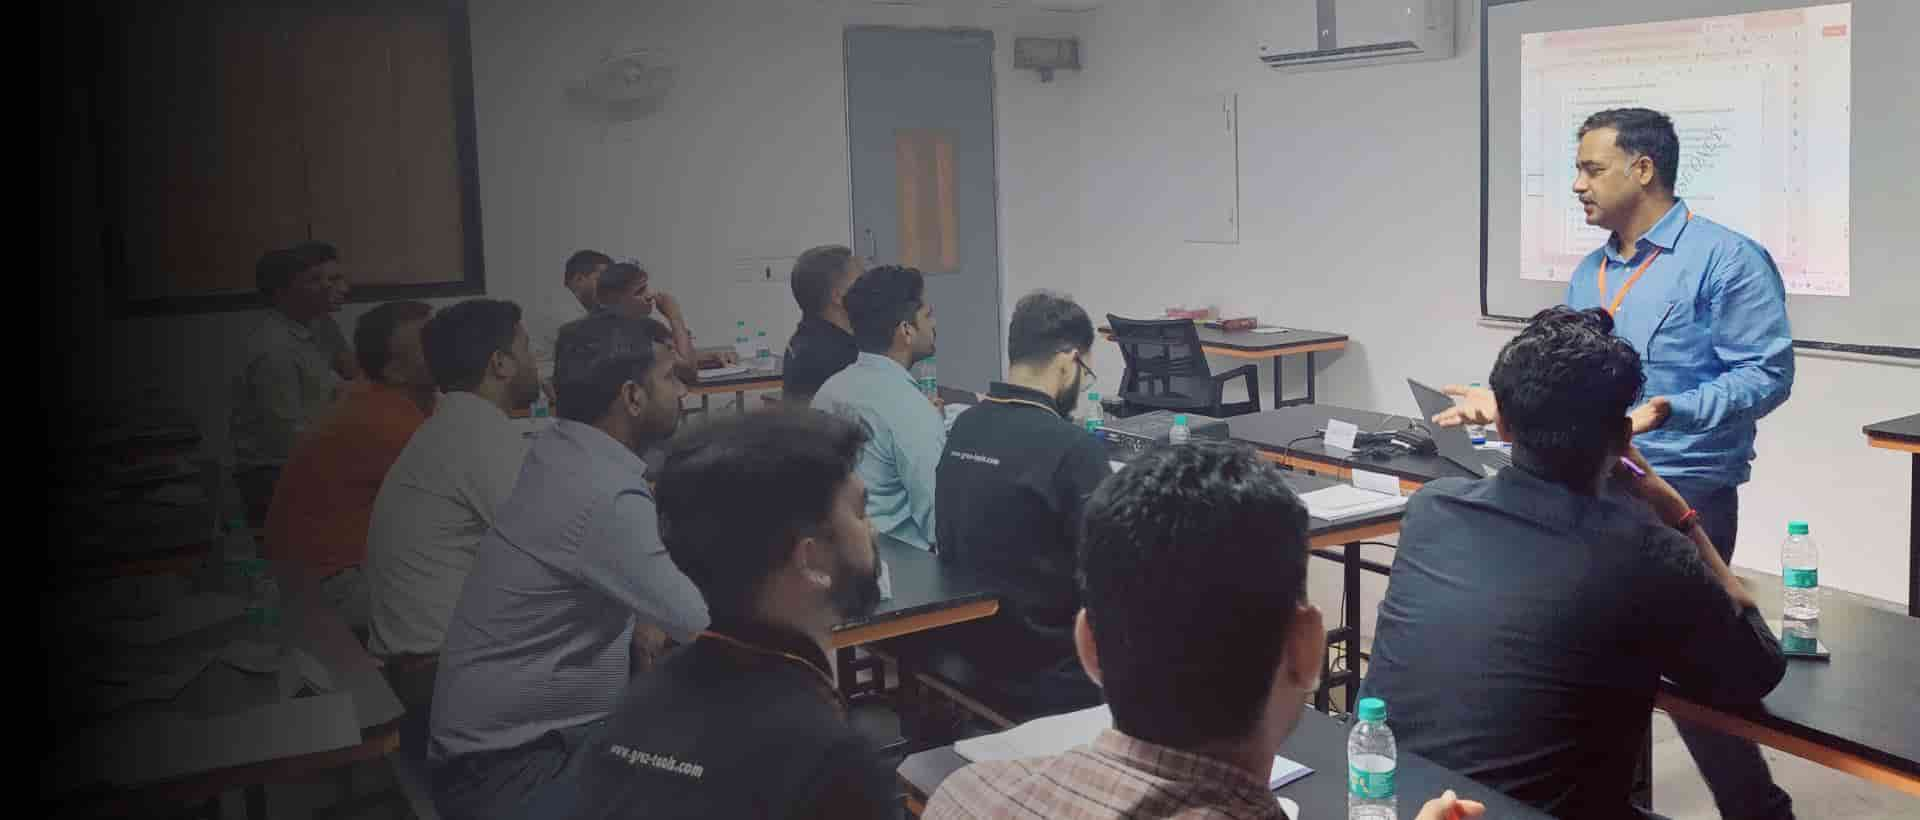
Build practical skills in management systems, internal auditing and team development.
Explore trainingUse the Sakhi Knowledge Centre to plan an audit, compare management systems or build an evidence checklist.
Explore the Knowledge CentreSee Sakhi training and workshops on management systems, supplier quality, sustainability and team development.
Explore Sakhi’s articles on consulting, auditing and training. For step-by-step guides and worked examples, visit the Knowledge Centre.


A process map helps a team improve when each handover shows who owns the next step, what must be accepted and what happens if an input is wrong. Build the first map from real work orders, then measure how long a job is worked on and how long it waits.
Pick a single trigger and finish event. For order fulfilment, start when a complete customer order arrives and finish at documented dispatch. Walk a normal order and an exception order with the people doing the work. In each swimlane record the input, acceptance rule, decision owner, output, evidence and exception path. Ask the receiving team what it actually checks. When a diagram disagrees with a real transaction, start by correcting the map.
Measure elapsed lead time separately from hands-on processing time. Pair median lead time with a measure of the slow cases, such as the 90th percentile when the sample is adequate. Track first-pass completion, rework loops and queue age by case type. Define how missing data and customer hold time are counted. Segment by product family or complexity before attributing a long queue to staff performance.
Use 5 Whys to investigate a specific, observed failure. Write evidence beside each proposed cause. Use an A3 when a cross-functional team needs a compact explanation of the gap, countermeasure and follow-up. Use 8D when a serious or repeated customer issue needs containment, a verified cause, permanent action and follow-up. A cause should predict where the failure appears and where it does not. Test that prediction before standardising the fix.
In 20 illustrative orders, 12 spent an extra day waiting for approval. Ten of those 12 lacked the same specification at intake. The team added a required field, defined when an exception could move forward, and sampled the next 20 orders of similar complexity. Review waiting time and first-pass completeness together so a faster queue cannot hide work sent back later.
A process improvement team can separate queue time from work time by collecting when an order became ready, when the next team started it and when the work finished. Segment by order type before comparing times across teams.
Take ten comparable orders. Agree whether the clock uses working hours or elapsed hours. Record incomplete orders separately so the sample does not hide current queues.
If a ready order waits 18 working hours and takes two hours to review, its queue share is 90% of the 20-hour stage. Compare the same calculation across the sample and look for a common handoff condition.
Pilot a complete-order checklist and a named receiver for one queue. Compare median and longest waits for equivalent orders, then check whether rework or missed deadlines moved to another team.
| Focus | What to check | Evidence or decision |
|---|---|---|
| Handover | What does the receiving team accept? | Complete-order acceptance checklist |
| Queue | When does work become ready or start? | Timestamp and age by work type |
| Rework | Why was work sent back? | Return code and verified cause |
SIPOC sets the scope by naming suppliers, inputs, process, outputs and customers. Use a swimlane or detailed map to diagnose actual handovers, decisions and exceptions.
Start with enough to see normal work and important exceptions across shifts or product families. Use a larger, defined sample before making claims about a KPI or sustained improvement.
Show what is being handed over, how the receiver knows it is ready, who owns exceptions and which event marks the next step as started. Those fields make the map testable.
Bring one delayed or reworked transaction. Sakhi can map the handovers with your team and help decide what to measure in the pilot.

 Guru Maa Ji


